
By: Wendy Parker*
Introduction
The Civil Rights Act of 1991[1] (“Act” or “1991 Act”) was thought to be a victory for employment discrimination plaintiffs—a “dramatic” expansion of their rights.[2] Twenty years later, however, we are told that the news for employment discrimination plaintiffs has gone “from bad to worse.”[3] Employment discrimination plaintiffs should expect defendants to win their pretrial motions.[4] Even if plaintiffs survive pretrial practice, they will likely lose at trial.[5] Other than settlement, the chances of any plaintiff recovery are quite thin.[6] Employment discrimination plaintiffs, or perhaps their lawyers, seem to have gotten the message. Employment discrimination suits are declining—even while Equal Employment Opportunity Commission (“EEOC”) filings are increasing.[7] Federal litigation is becoming less and less relevant to redressing employment discrimination.
In this Article, as this Symposium reflects on the twenty-year history of the 1991 Act, I explore just how much “worse” things are today for plaintiffs. I do this by asking two questions. First, are plaintiffs now less likely to win than they were before the passage of the 1991 Act? In other words, does today’s bad news obscure the progress made since 1991? Second, does the 1991 Act’s expanded jury-trial right provide all plaintiffs an equal chance at recovery? The increased access to a jury trial was thought to be a major advancement for plaintiffs, and this Article analyzes whether particular types of plaintiffs fare better than others through an original Jury Outcome Study of 102 jury trials.
Through these inquiries, I discover some optimistic news. Most significantly, plaintiffs today are more likely to win at the trial level than before the 1991 Act.[8] The expanded right to a jury trial granted by the 1991 Act[9] likely has improved trial win rates, but an increase in win rates in bench trials is partly at play as well.[10] The news, then, is not all bad.
But this is not a story of optimism. The increased win rate at the trial stage does not mean a greater percentage of plaintiffs are winning. Litigation filings themselves are declining.[11] Despite these reduced numbers, a lower percentage of plaintiffs proceed to trial today.[12] And even if plaintiffs present their cases to juries—the stage at which they enjoy their highest chance of success—losses are still likely.[13]
Nor are trials without risks for plaintiffs. In my Study of 102 jury trials and 10 bench trials, plaintiffs were much more likely to be ordered to write defendants a check—for the defendants’ costs—than the other way around.[14]
Most troubling, this is not a story of equality. Plaintiffs win most often before juries, but jury win rates differ with the category of plaintiff. For example, this Study reveals that African Americans and Latinos claiming race discrimination have the lowest jury win rates.[15] Empirical studies of employment discrimination litigation usually do not distinguish among the types of discrimination alleged or the types of plaintiffs involved.[16] The very few that do have also found that African Americans have lower win rates at various procedural stages.[17] No study examining this issue has found differently. Thus, although my evidence is far from overwhelming—I analyze only 102 jury trials—it adds to the increasing evidence of inequality.
The question then becomes, what causes the disparity? Many who study jury behavior would predict jury bias by white jurors against African-American and Latino plaintiffs.[18] While the evidence is increasing that juries are not neutral and it is likely that juror bias is partly at play, I conclude that the evidence of juror bias is not thus far conclusive in the context of employment discrimination litigation.[19] Other factors may also be at work.
This Article proceeds in three parts. Part I presents the story of the change promised by the 1991 Act and compares outcomes before and after the 1991 Act. Here we discover one optimistic comparison: trial outcomes today are actually higher than they were before the 1991 Act, while pretrial outcomes and settlement rates are about the same.[20]
Part II examines jury trials—the stage at which plaintiffs have the highest chance of success. We know surprisingly little about what types of plaintiffs are likely to win a jury trial. This Part analyzes 102 jury trials in seven judicial districts from 2005 to 2007. By examining outcomes in these jury trials, this Article demonstrates the uphill battle faced by African-American and Latino plaintiffs claiming race discrimination, particularly when compared to women claiming sex discrimination and others claiming race discrimination.
Part III is the heart of this Article and puts the results from Parts I and II in context. I demonstrate that my findings are consistent with the few other studies that disaggregate outcome data by the type of discrimination alleged and the type of plaintiff involved. Thus, my findings are less likely to be an exception and more likely to represent the reality of litigation for African Americans and Latinos.
In addition, many (but not all) who study jury behavior predict that jurors will bring their own biases into the jury room.[21] Specifically, many studies demonstrate a bias of white jurors against black defendants.[22] It would be easy to use this research to blame white juror bias for the disparate outcomes found in jury studies. And it is likely true that white juror bias is at least partly to blame. But without access to more information about the composition of the actual juries in this Study—some of which were probably all white, but some of which were probably diverse, and all of which reached unanimity for their verdicts—I am hesitant to end the analysis with that conclusion.[23] In fact, some recent research demonstrates a decrease in white juror bias when race issues are salient and when juries themselves are diverse.[24] Thus, the causes for the disparities—like the underlying problem of racism—are complex and not readily reducible to a single explanation. As is often true, more research is needed.
I. The Attempt at Change
This Part begins with a story of change: the increase in plaintiffs’ rights under the Civil Rights Act of 1991 (and other legislation), the litigation growth that followed, and the subsequent changes in the law. This Part then uses the research of others to make new comparisons between outcomes in employment discrimination cases before and after the 1991 Act. This analysis demonstrates that the news has never been very encouraging for employment discrimination plaintiffs. One data point is, however, most encouraging: plaintiffs today are more likely to win if they get to trial. Yet, plaintiffs are now less likely to make it to trial in the first place.
A. The 1991 Act
1. The Legislation Itself
Labeled a “quota” bill, the 1991 Act faced fierce opposition, including a presidential veto of a prior version of the bill in 1990.[25] Two events in 1991 altered the political calculus for those opposing the 1991 Act, especially for moderate Republicans. Former Klansman David Duke ran, unsuccessfully but surprisingly well, to become the Governor of Louisiana, and the Supreme Court confirmed Clarence Thomas to replace Thurgood Marshall on the Supreme Court, but only after a bruising battle that touched on sexual harassment in the workplace.[26] Both supporters and opponents of the 1991 Act heralded it as an extension of plaintiffs’ rights in employment discrimination cases.[27] The Act deemed wrong five Supreme Court opinions[28]—thereby “restoring” pro-plaintiff standards—and also granted plaintiffs new rights to compensatory and punitive damages[29] and jury trials.[30]
2. The Number of Suits Filed
Commentators have long noted the litigation “explosion” that followed the 1991 Act.[31] By 1997, employment discrimination filings[32] had tripled[33] to become the largest category of civil litigation, at 10% of the docket.[34] Two other points, however, are often missed and put this increase in needed context.
First, complaints about the growth in employment discrimination filings preceded the 1991 Act. The American Law Institute, for example, in 1989 bemoaned the “explosion” in such litigation.[35] Between 1970 and 1989, the number of suits increased from 336 to 7613, a 2166% increase.[36] Yet, that increase mainly occurred in the 1970s; the number of suits filed in the 1980s held fairly steady.[37]
Second, the number of employment discrimination suits began declining in 1998, after peaking at 23,796 in 1997.[38] Meanwhile, the overall civil docket has held fairly steady since 1985.[39] Between 1997 and 2006, employment discrimination filings decreased 40%.[40] As of 2009, employment discrimination litigation accounted for fewer than 6% of the civil federal court docket[41] and lagged behind personal-injury product-liability cases and habeas corpus petitions.[42]
By contrast, the number of EEOC charges held fairly steady through 2007[43] and then substantially increased in 2008 and remained high in 2009.[44] This suggests that the decreased federal litigation rate is not likely due to a decrease in perceived discrimination, but a decrease in workers and their lawyers seeking federal court intervention.[45] While the number of filings still exceeds that of 1990, the recent decline in filings suggests that the enthusiasm for federal court involvement is abating, even while employees continue to complain to the EEOC about discrimination.[46]
B. Subsequent Changes
1. Post-1991 Legal Changes
Like these numbers, the law of employment discrimination is far from static. The 1991 Act was not Congress’s only attempt at expanding plaintiffs’ rights in the workplace. The previous year, Congress recognized disability as a protected status in the workplace with the passage of the Americans with Disabilities Act (“ADA”),[47] which also certainly contributed to the increase in employment discrimination filings. In addition, the Family and Medical Leave Act of 1993 (“FMLA”) forbade for the first time discrimination against employees using protected family and medical leave.[48]
Two years after Congress effectively rebuked several of the Supreme Court’s employment discrimination opinions, the Court again made it more difficult to prove a disparate treatment claim in St. Mary’s Honor Center v. Hicks.[49] The Court has since placed significant restrictions on disability claims.[50] More recently, in Ricci v. DeStefano, the Supreme Court called into question the continued viability of disparate impact claims.[51] Congress again “corrected” Supreme Court rulings in the Lilly Ledbetter Fair Pay Act of 2009.[52]
Other Supreme Court opinions on federalism and pleading have also limited the rights of employment discrimination plaintiffs. The Court has restricted state employees from receiving compensatory damages when suing their employers under the Age Discrimination in Employment Act (“ADEA”)[53] and the ADA.[54] The Court has also increased the pleading burdens required to survive a motion to dismiss for all types of cases.[55] Preliminary results indicate that employment discrimination cases are particularly susceptible to these heightened pleading hurdles and are more likely to be dismissed before the discovery phase.[56]
All of these changes make it impossible to pinpoint the 1991 Act as the particular agent of change. Many factors obviously contribute to the ebb and flow of employment discrimination litigation outcomes.[57] Yet, given the significance of the 1991 Act, its twentieth anniversary is a good time to judge whether outcomes for plaintiffs are improving or getting worse.
C. Outcomes
The focus in this Subpart is whether plaintiffs have higher success rates than they did before 1991. Clear indications of better outcomes would be lower rates of losing on a pretrial motion (which are almost always filed by defendants) and higher win rates and award amounts at trial. Settlement rates, which are more difficult to interpret, are also examined here.
1. Pretrial Disposition
Pretrial disposition rates are about the same before and after the 1991 Act.[58] About 30% of employment discrimination plaintiffs have their cases terminated under either a motion to dismiss or motion for summary judgment.[59] These pretrial adjudication rates are quite similar to the rates for other types of cases.[60]
Yet, employment discrimination plaintiffs themselves are much less likely to win a pretrial adjudication than are plaintiffs in cases outside of the employment discrimination context.[61] That is, employment discrimination plaintiffs are more likely to lose on their own motion for summary judgment when compared to other types of plaintiffs.
While pretrial disposition rates have held fairly steady, with time more plaintiffs may lose on a motion to dismiss. From 2001 to 2003 the overall rate of pretrial judgments stayed about the same, but the percentage of dismissals increased, while summary judgments decreased.[62] The heightened pleading requirements in Twombly and Iqbal, decided in 2007[63] and 2009,[64] respectively, may further increase the rate of dismissals in the years to come.[65]
In sum, today pretrial adjudication rates are about the same as they were before the 1991 Act. Yet, the evidence indicates that plaintiffs may be more likely to lose a motion to dismiss in the future. Whether an increase in dismissals due to Twombly and Iqbal will correspondingly mean a decreased loss rate on motions for summary judgment—so that the overall pretrial adjudication rate stays about the same—is unknown at this time. Regardless, an increase in dismissals likely means fewer and lower settlements for plaintiffs. Professor Minna J. Kotkin has found that settlement rates and amounts increase after a defendant loses a pretrial motion.[66]
2. Trial Rates
Before the 1991 Act, juries were available in age discrimination claims under the ADEA and for intentional race discrimination claims filed under § 1981.[67] The 1991 Act made juries available for all claims brought under Title VII,[68] which is the most common statute for employment discrimination claims, by making compensatory damages available under Title VII for disparate treatment claims.[69] This perhaps had the largest impact on sex discrimination plaintiffs, who before had no access to jury trials.[70]
Trial rates are certainly down since the 1991 Act. Overall, the percentage of trials (both jury and bench) has declined from 18% in 1979 to 9% in 1990 and to 3% in 2006.[71] This decline is not unique to employment discrimination cases; federal cases in general are less likely to be decided by trial.[72] The number of employment discrimination jury trials has, however, increased substantially.[73] Correspondingly, the number of bench trials has declined.[74]
Interestingly, employment discrimination cases are more likely to reach trial than the rest of the federal civil docket.[75] Until 2003, employment cases were more likely to result in a bench trial than nonemployment cases.[76] Now the rate is fairly similar, with nonemployment cases slightly more likely to be tried in front of a judge.[77] Juries, however, are much more likely to resolve employment cases than nonemployment cases.[78] That began in 1994 and continues today.[79] In sum, while most employment discrimination cases are not resolved via trial, their jury-trial rates are higher as compared to other cases.
3. Trial Disposition Rates
Win rates for plaintiffs who reach trial are actually higher today than before 1991. From 1978 to 1985, plaintiffs’ success rate at trial was 22%.[80] By 1990, the win rate reached almost 24%.[81] The win rate was nearly 36% in 1998,[82] and this increased to just over 38% in 2001.[83] Other types of plaintiffs fare significantly better at trial, but the gap has narrowed considerably since 1997.[84]
The improved win rate is very likely due both to the growth in the number of jury trials and the increase in the win rate of bench trials. Plaintiffs’ win rates have always been higher when a jury decided the case, and jury-trial win rates have held fairly steady. From 1978 to 1985, juries found in favor of plaintiffs at a rate of almost 43%.[85] The jury win rates in 1990 and 2001 were similarly high and remained consistent, at 41%.[86] The bench-trial win rate, however, started much lower, at 16% in 1990, but increased to 33% in 2001.[87] While the bench-trial win rate has declined a little since 2001, it is still higher than it was in 1990.[88]
The reasons for the difference in jury and judge outcomes in employment discrimination cases have long been disputed. Some contend that a case-selection effect causes the disparities rather than anything particular to judges or juries.[89] Others argue that judge bias is at play.[90]
4. Trial Awards
The 1991 Act made additional damages available for Title VII litigation,[91] so one would expect award amounts to have increased, even apart from inflation rates. Yet, the one study making this comparison found a decrease in awards between 1990 and 2001.[92] This study of outcomes of all employment discrimination cases disposed of by trial between 1990 and 2001 found a median monetary award of $248,500 in 1990, but only $130,500 in 2001.[93] The difference could be due to the miscoding of data,[94] but the significant decline is still troubling and hints at the need for research and analysis into why the awards are declining.[95]
Juries continue to award more than judges, but the difference is decreasing. For example, the median jury award in 1990 was $440,000, but in 2001 dropped to $141,500.[96] The median bench award has stayed fairly constant. In 1990 the median bench award was $114,000, and in 2001 it was $112,500.[97] Other studies of civil rights cases in general consistently conclude that juries award higher damages than do judges.[98]
5. Settlement
A more difficult question is how to treat settlement, particularly given the lack of access to settlement amount data. Settlement is the most common disposition for employment discrimination cases.[99] I found little difference in settlement rates before and after the 1991 Act. In 1990, 35% of cases settled, and in 1998 that rate increased a little, to 39%.[100] By 2001 the rate had increased to nearly 43%,[101] but has declined since then.[102]
Employment discrimination cases do not settle more frequently than other cases,[103] but they are less likely to be settled early in the proceedings compared to other types of cases.[104] This means that employment plaintiffs must invest more time and money into their lawsuits before settling[105]—thereby increasing the cost of litigation to plaintiffs—but possibly gaining a higher award through the effort.[106]
Higher settlement amounts, even if settlement disposition rates remain the same, would very likely indicate better outcomes for plaintiffs, but settlement amounts are difficult to obtain. It is also hard to interpret overall settlement rates, detached from any information about merits or settlement amounts.[107] The little information available indicates that settlements are likely to be in the five-figure range, both before and after the 1991 Act.[108] The evidence comparing pre-1991 outcomes with post-1991 outcomes, however, is currently too thin a data set from which to draw any firm conclusions. The lack of increase in settlement amounts—despite the increased availability of damages in the 1991 Act[109] and the rate of inflation—suggests, however, that plaintiffs are not gaining an advantage in settlements after the 1991 Act.
6. Summary
In sum, employment discrimination cases are being filed at a greater rate since 1990, but filings have been declining since 1998.[110] By comparison, the overall civil docket has held fairly steady, while EEOC filings are recently up.[111] Pretrial dispositions in favor of defendants have remained fairly constant, but an increase in dismissals under Rule 12(b)(6) has occurred recently and that rate of dismissal may continue to grow.[112] Defendants win pretrial motions at about the same rate in employment discrimination cases as they do in other civil cases, but plaintiffs in employment discrimination litigation are much more likely to lose their own pretrial motions as compared to other plaintiffs.[113] As with the overall federal docket, fewer employment discrimination cases are decided by trial, but more are decided by a jury than before the 1991 Act, and the jury-trial rate today is higher for employment discrimination cases than for other cases.[114] Jury win rates have remained fairly constant after the 1991 Act and are lower compared to other cases.[115] Bench win rates are up since the 1991 Act, but are still lower than rates from other cases.[116] Trial award amounts are down, but more research is needed to determine why that is the case.[117] Lastly, settlement rates and amounts appear to be about the same as they were prior to the Act, but the research here is relatively sparse.[118]
II. Jury Outcome Study
This Part presents my Jury Outcome Study. Only a small percentage of employment cases reach juries—less than 3% (a higher rate than in other cases).[119] Yet, once before a jury, plaintiffs have their highest chance of success.[120] We know surprisingly little, however, about how juries treat particular types of claims and plaintiffs.[121] This Jury Outcome Study specifically identifies the plaintiff’s claim, instead of the usual methodology, which analyzes employment discrimination claims as a whole.[122] This Part starts with a description of the Jury Outcome Study and then analyzes the resulting data. Here, I reveal the low chances of success for some plaintiffs, particularly as compared to their peers.
A. Methodology
To find jury trials, my research assistant and I searched online databases maintained by the respective courts[123] to find the case summary sheet for all cases in seven districts (those districts for the cities of Atlanta, Chicago, Dallas, New Orleans, New York City, Philadelphia, and San Francisco)[124] filed between January 1, 2005, and December 31, 2007, with a case code of 442 (the code for employment discrimination filings)[125] with at least an eighteen-month disposition time.[126] When the case-summary sheet indicated that a jury or bench trial was held, the case was analyzed. The Study only included employment discrimination claims actually decided via trial. Claims disposed by pretrial motions, pretrial settlements, or post-trial motions were excluded. Using docket sheets and court documents, I assessed who won, and on what claims. Due to the Study’s focus on trial outcomes, I did not analyze subsequent appeals (although others have demonstrated that plaintiffs are likely to lose here as well)[127] or post-trial settlements.
Lastly, I excluded cases in which the plaintiff was pro se at the time of trial. This study evaluates win rates, and pro se plaintiffs are notorious for their low win rates.[128] With these exclusions, the Jury Study examined 102 jury trials. I also collected data on the bench trials meeting the same criteria, but only found ten such cases.
A major limitation on a study like this one is that the analysis of outcomes is detached from any analysis of a claim’s merits.[129] By excluding pro se cases, I likely excluded the cases with too little merit for a lawyer to accept and cases litigated with too little skill to be successful. Thus, the Study only includes claims that a lawyer deemed had some merit and were then litigated with some degree of lawyerly skill.
Other than this exclusion, it is quite difficult to assess the merits of employment discrimination complaints. The defendant’s subjective intent and plaintiff’s work skills are usually key issues and often involve conflicting stories, which do not lend themselves to objective assessments.[130] After all, the judge has likely ruled that reasonable jurors could disagree about the facts, thus necessitating an actual trial. As a result, the data below cannot be used to assess the quality of the underlying claims.
Yet, the data is useful for another analysis. I use the data instead to determine whether some plaintiffs fare worse than others. I proceed with the presumption that lawyers have similar incentives and skills to file or defend all types of employment discrimination suits.[131] The case selection effects should be about the same for all types of employment plaintiffs, with similar stakes and skills on both sides. Yet, we see in the Jury Outcome Study that some plaintiffs fare worse than other plaintiffs. These differences in outcomes suggest that something other than the usual reasons for low outcomes is at play.[132]
B. The Outcomes
Of the 102 jury trials, most were race/national origin claims (63%), followed by gender claims (26%).[133] The Appendix to this Article details the claims asserted in the 102 jury trials.[134] The data not in the Appendix can be accessed online.[135] The following chart summarizes the win rates for the most common types of discrimination by the type of discrimination alleged.
Figure 1
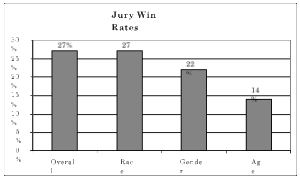
Overall, the plaintiff’s jury-trial win rate, 27%, is lower than what others have found for employment discrimination litigation (about 40%, which includes pro se plaintiffs).[136] Perhaps jury win rates are declining. This is a study of more recent cases than the earlier studies. Or maybe juries in these large metropolitan areas have lower win rates than the nation as a whole, which was the subject of some of the earlier studies.
Looking at broad categories of status, religion claims had the lowest win rate at 0% and FMLA claims had the highest win rate at 50%.[137] Yet, only two religion claims and two FMLA claims went to a jury, so it is hard to draw much from these outcomes.[138] Gender claims had a 22% win rate, and race and national origin claims had a win rate of 27%.[139]
The mean plaintiff award for all 102 jury trials was $493,080.[140] Gender claims had a comparatively low mean award at $229,884, while race and national origin claims had a mean award of $244,347.[141] Age and disability claims had seven-figure mean awards of $1,917,872 and $1,458,667, respectively.[142]
The disparities in damages could be due to a number of factors–the earning capacity of the plaintiff,[143] the size of the employer given the statutory caps under Title VII,[144] the lack of economically based adverse employment action in some sexual harassment claims,[145] and the liquidated damages available under the ADEA.[146] Thus, it is difficult to draw any conclusions from these differences in damage awards. The variances might very likely be due to the different types of plaintiffs and claims before the jury and to underlying damage principles, rather than any bias or preference.
Interestingly, when looking at all trials, both bench and jury, it was slightly more likely that the plaintiff was ordered to pay the defendant its costs than it was for the plaintiff to recover any damages. In the 112 trials (this includes ten bench trials and 102 jury trials) with a represented plaintiff, plaintiffs won twenty-nine cases, with damages awarded in all twenty-nine cases.[147] Yet, in thirty-one cases, the plaintiffs lost at trial, and were ordered to pay the defendants’ costs.[148] Granted, the amounts of the defendants’ costs were much lower than the plaintiffs’ awards.[149] The mean amount awarded to the defendant for costs was $7678.[150] It is also entirely possible that the plaintiff never paid the defendant’s costs—with either the parties settling that claim, perhaps in exchange for the plaintiff not pursuing an appeal, or with the defendant not pursuing payment. Regardless, this suggests a risk for plaintiffs in taking their claims to trial.
Certain types of plaintiffs outperformed other types within the same category.[151] For example, women were much more likely to win their claims of gender discrimination than men.[152] Women won 27% of their jury trials, while men won 0%.[153]
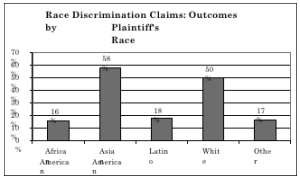
In the category of discrimination based on race and national origin, the overall 27% win rate was inflated by the high win rate of whites (50%, n=4) and Asian Americans (58%, n=12).[154] Those claiming discrimination based on their status as African American or Latino, however, were much less likely to win, with respective win rates of 16% (n=31) and 18% (n=11).[155] Latinos also had by far the lowest mean plaintiff award, at $55,887.[156] African Americans, on the other hand, had the highest mean award in the race discrimination category, at $347,482.[157]
Figure 2
The meaning of these disparate outcomes is the subject of the next Part.
III. Inequality and Juries
This Part explores likely meanings of the disparate jury outcomes experienced by African-American and Latino plaintiffs claiming race discrimination. It begins by examining whether this outcome is consistent with other studies. Few studies disaggregate employment discrimination claims by type of discrimination or plaintiff.[158] Those that do demonstrate that African-American plaintiffs are more likely to lose than other plaintiffs[159]—just as this Study found for African-American plaintiffs claiming race discrimination.[160] I then explore what scholars studying jury behavior would predict. Social psychologists often find evidence of racial and gender bias in juries, particularly in the criminal arena.[161] These biases may partly explain the results in the Jury Outcome Study. Before assigning the sole responsibility for the disparity on juror bias, however, more information about the racial composition of the juries themselves is needed, particularly given the unanimity requirement for juries, the possibility of diverse juries, and the gaps in the social science research.
A. Other Studies
Most studies of employment discrimination suits examine such litigation as a whole.[162] The few studies that disaggregate the data by type of claim and plaintiff, however, conclude that plaintiffs do not fare equally in their employment discrimination suits.[163]
A study by the American Bar Foundation (“ABF”) examined a random sampling of 1672 employment discrimination suits filed between 1988 and 2003 in the seven districts studied herein.[164] That study concluded that African-American plaintiffs claiming any type of discrimination were more likely to lose at all stages of litigation than other employment discrimination plaintiffs.[165] Specifically, they were more likely to have their cases dismissed or lose on summary judgment, and less likely to settle or prevail at trial.[166]
By comparison, female plaintiffs claiming any type of discrimination fared much better than other employment discrimination plaintiffs. Their claims were less likely to be dismissed or denied on summary judgment than male plaintiffs, and more likely to settle or prevail at trial.[167] Like the Jury Outcome Study, the ABF study found that “men filing Title VII sex claims fare worse than women, but that whites filing race claims do somewhat better than African Americans.”[168]
Professor David Benjamin Oppenheimer examined California jury verdicts in 272 employment discrimination cases from 1998 to 1999 and was able to disaggregate the data and examine intersectionality of claims.[169] Overall, plaintiffs claiming race discrimination were more likely to lose their cases than were employment discrimination plaintiffs as a whole.[170] As the Jury Outcome Study revealed, white plaintiffs fared significantly better than nonwhite plaintiffs when claiming race discrimination.[171] Professor Oppenheimer also found that sexual harassment claims had the highest win rate, especially for men claiming same-sex sexual harassment.[172] In the Jury Outcome Study, women fared better than men in gender discrimination claims, but none of the four cases involving men in the Study involved same-sex harassment.[173]
Professor Oppenheimer also discovered particularly low win rates when intersecting categories.[174] He summarized his thorough and interesting study of California juries with this: “[T]he case is strong that judges and juries in California are far more skeptical of race and sex-based employment discrimination claims brought by black women, and age-based employment discrimination claims brought by women over forty, than other employment law claims.”[175]
Settlement rates also differ by claim. In one study, sexual harassment claims had the highest settlement rate, while race claims were the least likely to settle.[176] Similarly, Professor Kotkin’s study on settlements revealed that race claims had the lowest median settlement rates and a disproportionate representation in the category of very low settlements.[177] This may have been partly explained by the high proportion of pro se plaintiffs claiming race discrimination, given that pro se plaintiffs typically have lower success rates.[178] Yet, the study still indicated that whites claiming race discrimination had higher settlements.[179]
Nor did I find studies demonstrating that African Americans fared better than other plaintiffs. Thus, the Jury Outcome Study’s findings are less likely to be an aberration, but instead likely to be representative of the reality of race discrimination litigation for African Americans and Latinos. The next Subpart turns to research on jury behavior to explore possible explanations for these negative outcomes for African-American and Latino plaintiffs.
B. Jury Behavior
1. Jury Demographics
My Study did not include an analysis of the racial makeup of the 102 juries.[180] The populations of the districts studied (Atlanta, Chicago, Dallas, New Orleans, New York City, Philadelphia, and San Francisco) are relatively diverse. Yet, the juries are still more likely to have greater white membership than African-American or Latino membership given the demographics of even diverse communities. For example, in the Southern District of New York (“SDNY”), whites comprise a majority of the members of the qualified jury wheels used to select jurors.[181] The same is true for nonfederal civil trials in Cook County, Illinois, which includes the City of Chicago.[182] In addition to this numerical minority status, qualified African Americans and Latinos are less likely to be placed on the qualified jury wheel in SDNY.[183]
Because whites outnumber minorities even on Chicago and New York City juries, “minority defendants are [at] a significantly greater risk of facing a jury that is disproportionately white.”[184] Sometimes this translates into all-white juries. In the Chicago study, 28% of six-member juries had no African-American members, and 66% had no Latino members, making all-white juries far from unknown.[185] Thus, I presume that most of the juries in this study had some minority representation, but that whites still predominated. I also presume that if Chicago has a number of all-white juries, other districts will as well. Federal civil juries typically have only six members, and one study concluded that a six-person jury is less likely to be diverse than a twelve-member jury.[186] Yet, all jurors must reach the same conclusion; federal civil juries have a unanimity requirement.[187]
2. Juror Bias
Newspapers regularly report the racial and gender composition of juries, thereby implying that a jury’s demographics matter.[188] The Supreme Court’s prohibition against peremptory challenges based on race or gender also presumes at some level that a juror’s race or gender affects how that juror will decide a case.[189] Similarly, a recent and innovative study of female judges found that women claiming sex discrimination were more likely to win when at least one of the appellate judges is female.[190] Psychological research also has demonstrated considerable racial bias in the population at large.[191] In other words, in many arenas we believe that a person’s race and gender impacts how that person might determine a case.
This Subpart examines whether social psychological research on jury behavior—what some call jury discrimination[192]—is at least part of the reason for the less favorable outcomes suffered by African Americans and Latinos alleging race discrimination. That is, are white jurors too unlikely to believe African Americans’ and Latinos’ claims of race discrimination? Because minorities also serve on juries, this Subpart further analyzes whether, and how, minority representation will likely impact outcomes in race employment discrimination suits.
Many studies of white jurors in criminal cases would predict bias by white jurors against African Americans. Social psychologists have fairly consistently found in criminal cases that white jurors are more likely to convict African-American defendants, more likely to impose longer sentences on African-American defendants, and less likely to convict in cases with African-American victims.[193] The studies with white jurors and Latino defendants are fewer in number, but overall consistent with what has been found for white jurors and African-American defendants.[194]
One might infer from these criminal studies that whites would have a similar bias in civil cases, but few have done similar studies in the civil context. One study by Professors Ted Eisenberg and Martin Wells found that an increase of African Americans in the jury pool correlated with an increase in successful employment discrimination cases, but this finding only held in federal court, and not in state court.[195]
Studies also document the impact of women serving on juries. Specifically, women are more likely than men to convict defendants accused of rape, and more likely to convict and award longer sentences to defendants accused of crimes against children.[196] Women jurors also rule more often in favor of women alleging sexual harassment.[197]
I find it fairly easy to relate the Jury Outcome Study’s higher win rate for women claiming sex discrimination to the prevalence of women on juries.[198] Even without access to information about demographics of the 102 juries, it is hard to imagine any of the juries being all male, or not having a significant representation of women. The prevalence of women on juries likely has a strong effect on jury outcomes in sex discrimination cases, similar to the presence of female judges at the appellate level.[199]
Explaining the low win rate of African Americans and Latinos by pointing to white juror discrimination is tempting as well. Plenty of evidence in the criminal law context would support this conclusion.[200] To the extent, however, that people of color are on the juries, the biases of those juries would depend on finding biases on behalf of those jurors, or a willingness to go along with biases of the white jurors. Here the evidence is quite thin; most evidence indicates a bias of African-American jurors for African-American parties, and little research examines how African Americans and whites interact on juries.[201] Also unexplained by the juror-bias studies is why Asian Americans have higher win rates, unless one supposes that whites do not have the negative stereotypes about Asian Americans that they have against African Americans and Latinos—which may, in fact, be true.[202]
Yet, I ultimately conclude that while white juror bias may be at issue—especially on all-white juries—more research into the demographics of the actual juries is needed to determine to what degree that bias causes disparate outcomes. The presence of all-white juries would be particularly instructive, but to what extent all-white juries decided race discrimination claims is simply unknown.
In addition, the issue of disparate jury outcomes is likely too complicated for simple conclusions. For example, the studies of white juror bias are not without critics. While many find instances of jury discrimination by whites, Professors Samuel Sommers and Phoebe Ellsworth argue fairly persuasively that most of the criminal studies are too limited in scope and technique to be ultimately conclusive in labeling white jurors as generally discriminatory.[203] They particularly fault many studies for examining only white jurors, without comparing those jurors’ outcomes with those of African-American jurors (who may have a bias similar to that of the whites in the study), and for determining only how individuals react, when actual jurors decide cases collectively, as members of a jury.[204]
Professors Sommers and Ellsworth agree that white juror bias exists, but their research suggests it would be less prevalent in employment discrimination litigation.[205] They draw on psychological research demonstrating that white bias is “more likely when salient norms regarding racism are absent.”[206] That is, in the “run-of-the-mill” situation, whites will demonstrate bias, but when race becomes an issue, whites demonstrate less bias.[207]
Relying on this research, they conducted two mock jury studies. They found that an increase of racial salience in a criminal trial actually decreases the disparate impact of white juror discrimination on African-American defendants.[208] Thus, “[w]hen racial issues were made salient in the case, individual White mock jurors were equally likely to vote to convict the White and Black defendant. When race was not salient, Whites gave higher guilt ratings and longer sentence recommendations to the Black defendant than to the White defendant.”[209]
Employment discrimination cases filed on the basis of race by their nature make race issues salient. The research of Professors Sommers and Ellsworth suggests, therefore, that the biases of white jurors may be less at play in employment discrimination than many of the criminal jury studies suggest.
This may be particularly true for juries that are diverse. Professors Sommers and Ellsworth further argue that jury diversity improves the quality of outcomes and decreases racially disparate outcomes.[210] Specifically, one study indicated that “racial diversity has a significant effect on the judgments of White jurors and on their contributions to deliberations.”[211] Even before the juries began to deliberate, whites on diverse juries were less likely to convict African-American defendants than whites on all-white juries.[212] Thus, to the extent the juries in this Study were not all white, this research further suggests something in addition to white juror bias is at play.
The idea of juror bias is consistent with many studies and with the enduring nature of racism. To the extent that the juries studied herein were all white, juror bias could very well cause disparate outcomes for African-American and Latino plaintiffs alleging race discrimination. The picture becomes more complicated, however, to the extent that the juries were not all white. Research on the value of diverse juries and on the reaction of whites when race issues are salient would suggest that something more than white juror bias is at issue. Perhaps the legal standards do not adequately capture today’s expressions of discrimination against African Americans or Latinos. Further, pretrial rulings by judges could be affecting the claims and evidence presented to juries. In short, while white juror bias may be at play, other factors likely are as well.
Conclusion
The news is not all bad for employment discrimination plaintiffs. Since the passage of the Civil Rights Act of 1991, plaintiff outcomes in trials are up. Juries resolve more employment discrimination claims than before, and plaintiffs continue to do best when a jury decides the facts. Even bench trials are more welcoming to plaintiffs than before the Act’s passage.
Yet, a disconnect between perceived discrimination and judicially found discrimination exists. EEOC filings are up, but federal court filings are down. Further, the most common type of EEOC complaint—a race discrimination claim filed by an African American—faces decreased odds of winning a jury trial when compared to other employment discrimination plaintiffs. Why African Americans and Latinos have depressed win rates—a finding not unique to this jury study—could possibly be explained by biases jurors typically bring to the jury room, and an increase in jury diversity could possibly help to ameliorate some of this bias.
APPENDIX
Table 1: Plaintiff Trial Success Overall
|
Number |
Winning Plaintiffs |
Plaintiff Win Rate |
Mean Plaintiff Award |
|
| All Trials |
117 |
29 |
25% |
525,070 |
| Jury Trials |
104 |
28 |
27% |
493,080 |
| Bench Trials |
13 |
1 |
8% |
1,420,797 |
Table 2: Trials with Plaintiff Represented by Counsel
|
Number |
Winning Plaintiffs |
Plaintiff Win Rate |
Mean Plaintiff Award |
|
| All Trials |
112 |
29 |
26% |
525,070 |
| Jury Trials |
102 |
28 |
27% |
493,080 |
| Bench Trials |
10 |
1 |
10% |
1,420,797 |
Table 3: Jury Trials with Plaintiff Represented by Counsel
|
Number |
Winning Plaintiffs |
Plaintiff Win Rate |
Mean Plaintiff Award |
|
| Race / National Origin |
64 |
17 |
27% |
244,347 |
| African American |
31 |
5 |
16% |
347,482 |
| Asian American |
12 |
7 |
58% |
233,946 |
| Latino |
11 |
2 |
18% |
55,887 |
| White |
4 |
2 |
50% |
300,000 |
| Other National Origin |
6 |
1 |
17% |
67,088 |
| Gender |
27 |
6 |
22% |
229,884 |
| Female |
22 |
6 |
27% |
229,884 |
| Male |
5 |
0 |
0% |
0 |
Table 4: Nature of Claim
|
Number |
Winning Plaintiffs |
Plaintiff Win Rate |
Mean Plaintiff Award |
|
| Age |
14 |
3 |
21% |
1,917,872 |
| Disability |
7 |
2 |
29% |
1,458,667 |
| FMLA |
2 |
1 |
50% |
11,145 |
| Religion |
2 |
0 |
0% |
0 |
Table 5: District Court
|
Number |
Winning Plaintiffs |
Plaintiff Win Rate |
Mean Plaintiff Award |
|
| Atlanta (N.D. Ga.) |
14 |
3 |
21% |
144,647 |
| Chicago (N.D. Ill.) |
17 |
2 |
12% |
53,241 |
| Dallas (N.D. Tx.) |
11 |
1 |
9% |
11,145 |
| New Orleans |
(E.D. La.)
5
0
0%
0
New York (S.D.N.Y.)
31
13
42%
208,413
Philadelphia
(E.D. Pa.)
15
5
33%
1,308,397
San Francisco (N.D. Cal.)
9
4
44%
1,000,829
* Professor of Law, Wake Forest University School of Law. [email protected]. Many thanks to Brian Dempsey and Alanna Zuchelli for organizing a stellar Symposium on the twentieth anniversary of the Civil Rights Act of 1991. I also thank my research assistant, Naomi Huntington, who provided invaluable assistance, and Mike Selmi, who gave many helpful comments.
/cms/documents/nielsen_abf_edl_report_08_final.pdf; David Benjamin Oppenheimer, Verdicts Matter: An Empirical Study of California Employment Discrimination and Wrongful Discharge Jury Verdicts Reveals Low Success Rates for Women and Minorities, 37 U.C. Davis L. Rev. 511 (2003); Laura Beth Nielsen et al., Uncertain Justice: Litigating Claims of Employment Discrimination in the Contemporary United States (Am. Bar Found., Research Paper No. 08-04, 2008), available at http://papers.ssrn.com/sol3/papers.cfm
?abstract_id=1093313.
/Statistics/JudicialBusiness/JudicialBusiness.aspx?doc=/uscourts/Statistics
/JudicialBusiness/2009/appendices/C02ASep09.pdf (reporting the number of suits filed in 2009); Marika F.X. Litras, U.S. Dep’t of Justice, Civil Rights Complaints in U.S. District Courts, 2000, at 1 (2002), http://bjs.ojp.usdoj.gov
/content/pub/pdf/crcus00.pdf (reporting the number of suits filed in 1990).
/parkerwm/juries/ (last visited Mar. 28, 2011). This Technical Appendix includes all of the data for this Article in Excel format.
/mpsa08/index.php (go to “Search Papers” tab, enter “Measuring a Fair Cross-Section of Jury Composition” into the search field, select “Title” under the “Search By” field, and select “Search”).


